Formalising Gaventa · Figure 1 · 28 Aug 2026
The ignition boundary
What it takes for a dominant actor to hold a population quiescent after losing its material base, and the point past which no amount of ideological spending, funded from the relationship itself, can restore the silence.
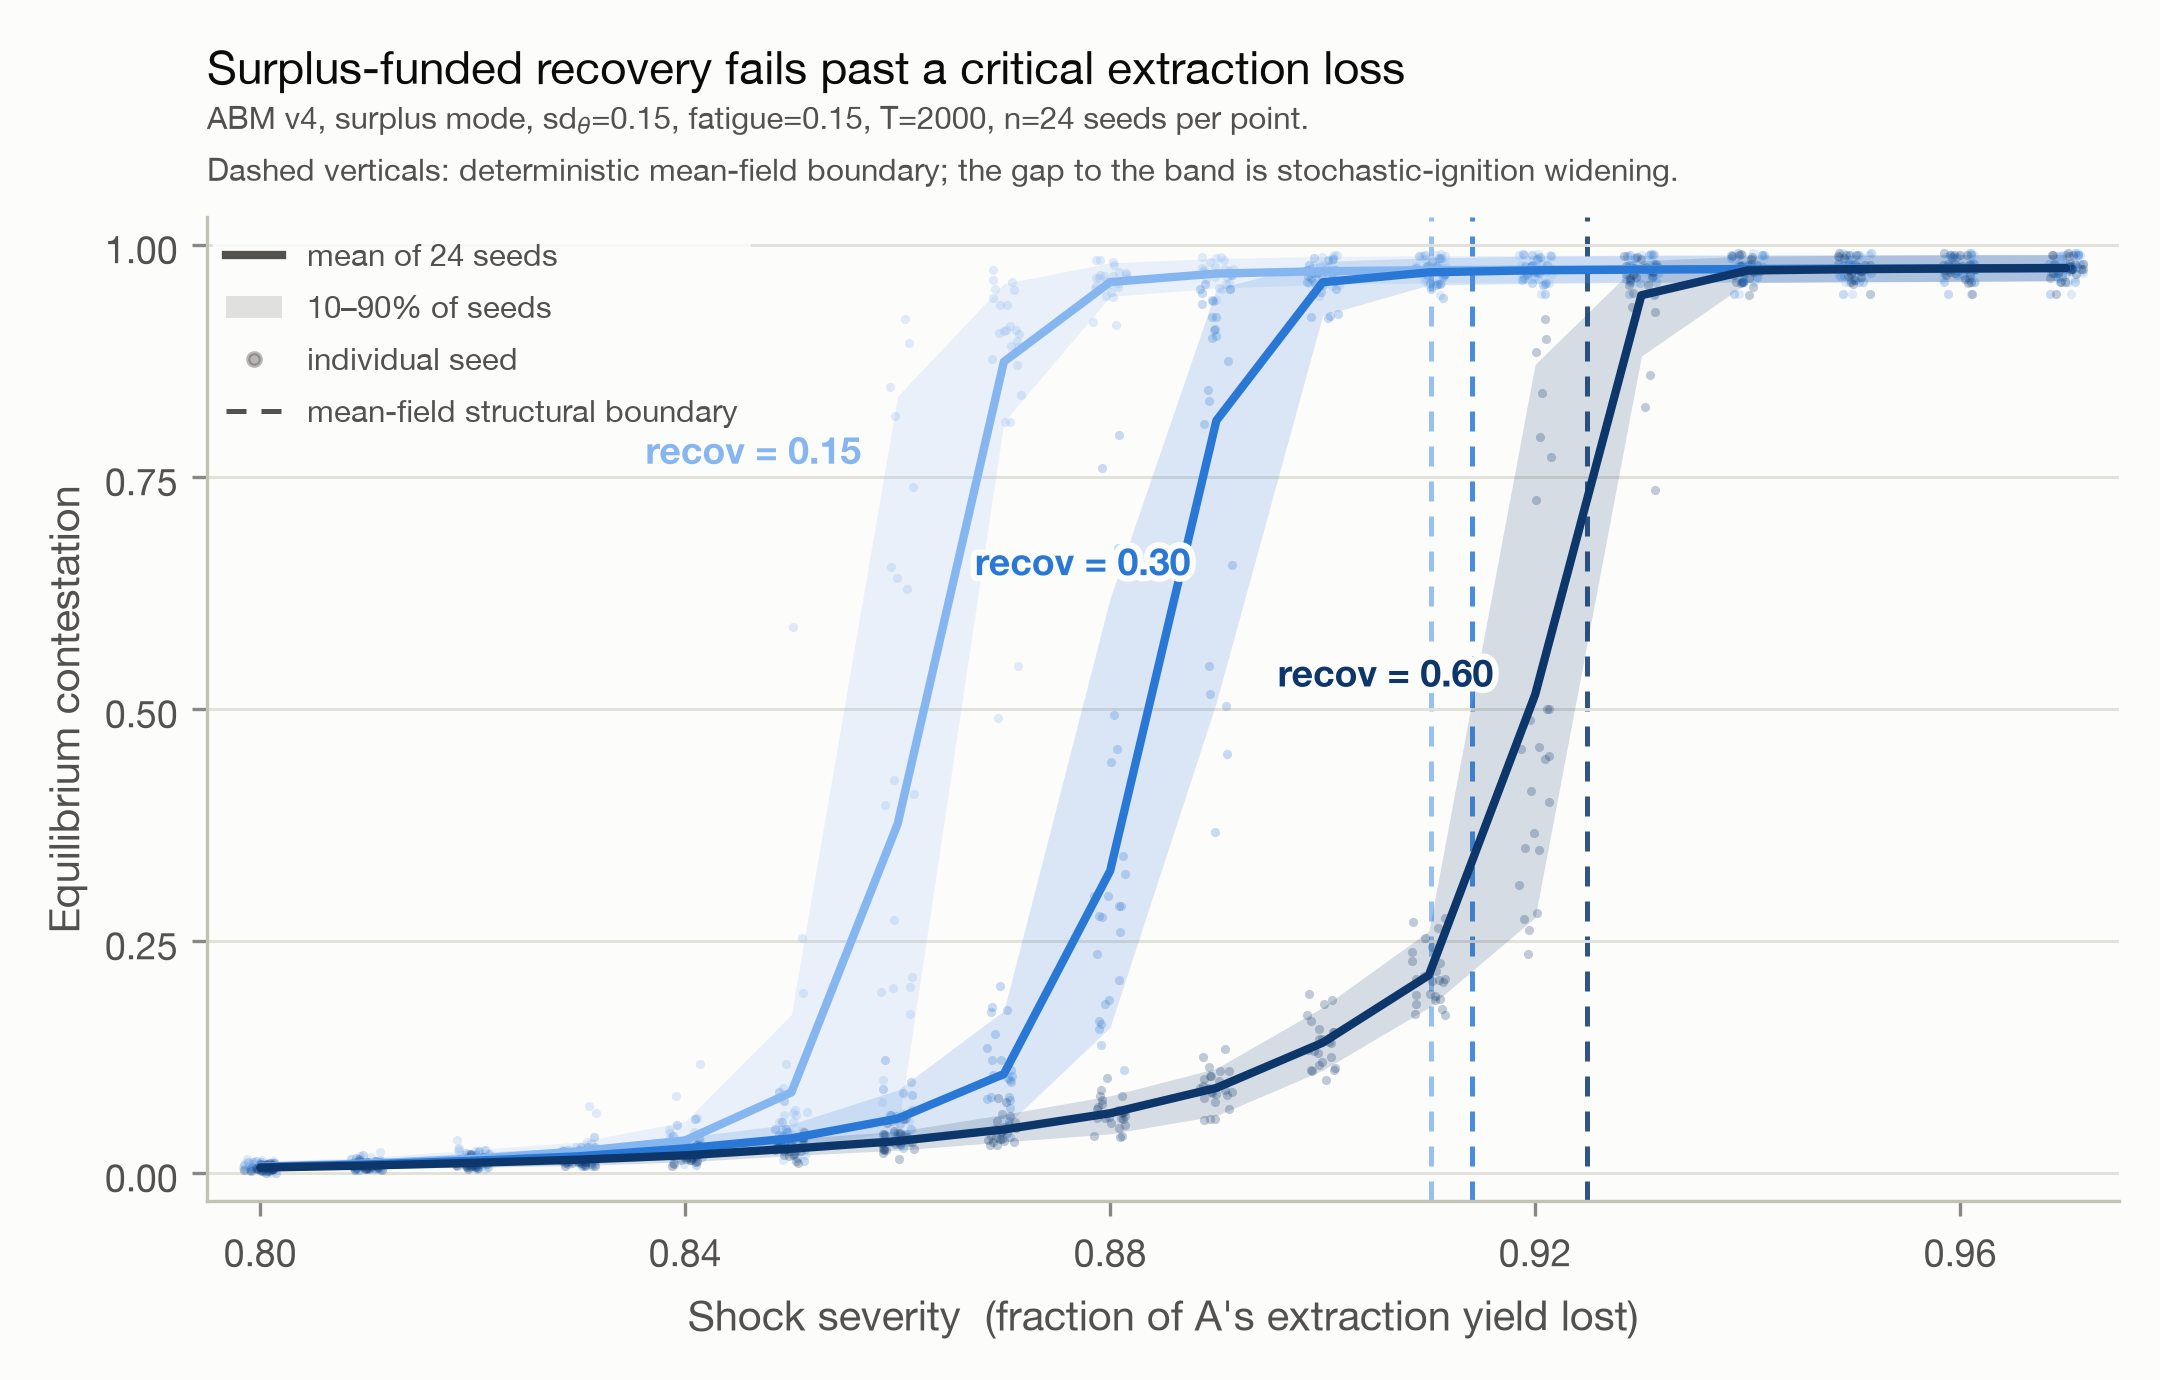
Fig. 1. Equilibrium contestation against shock severity under surplus-funded counter-mobilisation, for three legitimation intensities. ABM v4, surplus mode, sdθ = 0.15, fatigue = 0.15, T = 2000, n = 24 seeds per point. Dashed verticals mark the deterministic mean-field boundary for each intensity.
What is being simulated
The model is a formalisation of Gaventa's Power and Powerlessness (1980): a population of 400 agents whose political consciousness grows against a dominant actor A's ideological suppression, gated by individual thresholds, with mobilisation and open contestation following only after consciousness. At a chosen moment A suffers an exogenous shock, and the x-axis is its severity, the fraction of A's extraction yield permanently lost. Gaventa's claim is that challenge follows "loss in the power of A"; the figure asks exactly how much loss, and what A can do about it.
In this experiment A's counter-mobilisation is surplus-funded: when threatened, A
invests in re-legitimation, but the investment scales with the surplus the relationship still
yields. The three curves vary the intensity of that response, recov. The
y-axis is where the system settles, the share of the population in sustained open
contestation averaged over the last 40 per cent of a long run, so every point is an equilibrium
rather than a snapshot.
How to read each element
- The three curves
Means over 24 independent seeds, one curve per legitimation intensity: light blue recov = 0.15, mid 0.30, dark 0.60. Each is a sharp sigmoid, so quiescence holds almost perfectly below its transition and contestation then jumps to about 0.98.
- The shaded band
The 10th to 90th percentile across seeds. Where it is wide, identical societies with the same parameters end up in genuinely different places.
- ● ● ●Individual seeds
Every run is plotted. Inside a transition the points spread continuously from about 0.1 to 0.8, which is genuine sustained partial contestation rather than a coin flip between two absorbing outcomes. The variance is a finding, which is why it is not averaged away.
- Dashed verticals
The structural boundary of the deterministic mean-field reduction, that is the same equations with no noise and no individual agents, located by bisection for each intensity.
- recov 0.15 · ignites ≈ 0.86 · MF 0.910
- recov 0.30 · ignites ≈ 0.89 · MF 0.914
- recov 0.60 · ignites ≈ 0.92 · MF 0.925
The three findings in the picture
- Quiescence fails as a cliff, not a slope.
Below its boundary each society absorbs the shock, and contestation stays under a few per cent even after the loss of 80 per cent of the extraction base. Above it, contestation is near-total. Between them lies a narrow band of real, sustained partial struggle, with A's legitimation and B's mobilisation locked in an ongoing contest neither wins.
- Legitimation intensity delays ignition without moving the cliff.
The dashed structural boundaries barely move as A quadruples its ideological effort: 0.910, 0.914, 0.925. What moves is where the stochastic system actually ignites, at about 0.86, 0.89 and 0.92. Noise and individual variability let rebellion catch fire well before the structural limit, and what ideological spending buys is suppression of those early sparks, an effect that runs out exactly at the nearly fixed cliff.
- Past about 0.93, surplus-funded recovery is impossible at any intensity.
Beyond the cliff the response is starved by the very shock it answers, because the threat destroys the surplus that funds the counter-mobilisation. In separate runs, quiescence out there is restored only by an extraction-independent ideological channel, that is legitimation subsidised from outside the challenged relationship by a state, a church or a national ideology.
A's ideological spending defends against noise-triggered rebellion, not against the structural consequence of extraction collapse.
Why this matters for Gaventa
Gaventa argued that the third dimension of power is "self-propelled", that quiescence maintains itself, and that challenge appears only on a shift in the power relationship. The figure makes both halves precise and adds two claims the causal-loop diagram cannot express: the shift has a threshold with a hard ceiling, and self-repair works only while the dominated relationship still yields the resources that fund it. It also explains why Clear Fork Valley could stay quiet through decades of visible exploitation and then move, since below the cliff whether a community ignites is genuinely stochastic, a matter of which sparks occur, and ideological investment is effective precisely and only against those sparks.
Reading the fine print
Every comparison is paired: the same seeds, networks and thresholds are reused across intensities and severities, so curve separations are not sampling noise. Thresholds are drawn from an atom-free truncated normal. An earlier version of this figure's headline, a sign reversal at high heterogeneity, was traced to boundary clipping in the threshold distribution and retracted, and the distribution is now a defended modelling choice. The mean-field overlay is the same model with the population replaced by its threshold distribution, which is what licenses calling the gap between dashed line and coloured band stochastic-ignition widening.
Provenance: abm_v4.py (model) and fig_boundary.py (this
figure), part of the Formalising Gaventa working paper. Simulation data cached in
fig_boundary_data.csv; re-render with python3 fig_boundary.py --plot-only,
full re-simulation about 90 seconds. Palette: validated single-hue ordinal ramp. 28 August 2026.